Various ways of misusing yahi
It’s one feature I like of yahi you can combine
Notch: choose your input and Shoot: choose and aggregate your data programmatically
abuse yahi_all_in_one_maker
to obtain versatile results
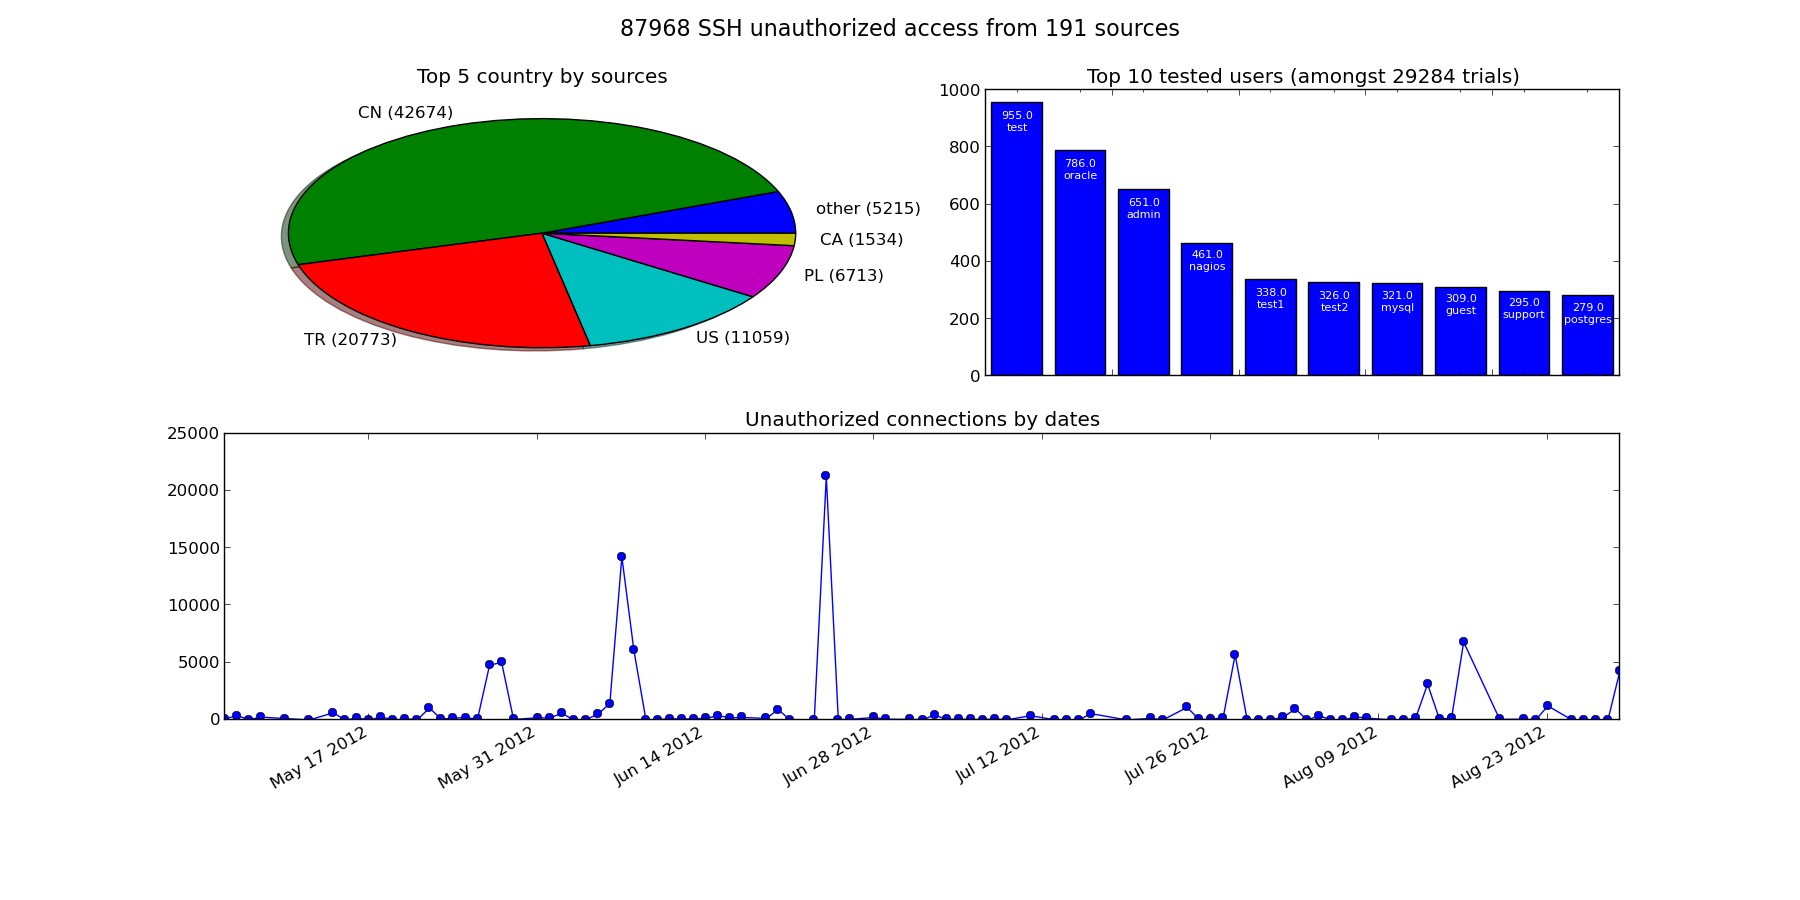
parsing auth.log
Imagine you are a sysadmin and your boss want a graph of all the request you do, and you don’t like using excel
#!/usr/bin/env python
from archery import mdict
from yahi import notch, shoot, ToxicSet
from datetime import datetime
from datetime import date
import locale

import dateutil
import re
import pylab as plt
from collections import OrderedDict
import numpy as np

locale.setlocale(locale.LC_ALL,"C")

def ordered_top(amdict, rank=10):
    res=OrderedDict({"other": 0})
    for i,(k,v) in enumerate(
            sorted(amdict.items(),
                key=lambda (k,v): (v,k),
                reverse=True)
            ):
        if i < rank:
            res[k]=v
        else:
            res["other"]+=v
    return res


######################## Setting UP ##################################
# parsing command line & default settings. Return a not fully qualified object
context=notch(
    off="user_agent",
    log_format="custom",
    output_format="json",
    date_pattern="%b %d %H:%M:%S",
    log_pattern="""^(?P<datetime>[^\ ]+\s{1,2}\d{1,2}\s\d{2,2}:\d{2,2}:\d{2,2})\s
    (?P<nawak>[^:]+):\s
    Invalid\ user\ (?P<user>.*?)\s
    from\ (?P<ip>.*)$""")
# log sample
#May 20 12:14:15 lupin sshd[36291]: Invalid user dave from 69.60.114.57

date_formater= lambda dt :"%s-%s-%s" % ( dt.year, dt.month, dt.day)
res= shoot(
        context,
        lambda data: mdict({
            "black_list" : ToxicSet([ data["ip"] ]),
            "by_country" : mdict({ data["_country"] : 1 }),
            "date_s" : mdict({ date_formater(data["_datetime"]) : 1 }),
            "by_ip" : mdict({ data["ip"] : 1 }),
            "date" : mdict({ date(2012,
                data["_datetime"].month,
                data["_datetime"].day)
                : 1 }),
            "by_user" : mdict({ data["user"] : 1 }),
            "total" : 1
        })
    )

# Let's go draw some plot
def labeled_bar(ax, mdict):
    pos=np.arange(len(mdict)) + .5
    ax.set_xticks(pos, mdict.keys())
    rects=ax.bar(pos,mdict.values(),label=mdict.keys(),align='center')
    for i,rect in enumerate(rects):
        height = rect.get_height()
        ax.text(rect.get_x()+rect.get_width()/2., height-100,
           '%.1f\n%s'%(height,mdict.keys()[i]),
           ha='center', va='bottom',color='white', fontsize=8)
    return rects

fig=plt.figure(221,figsize=(18,9))
fig.suptitle(
    "%d SSH unauthorized access from %d sources" % (
        res["total"], len(res["black_list"])),
    fontsize=16,
)
ax=fig.add_subplot(221)
by_country=ordered_top(res["by_country"],5)
ax.set_title("Top 5 country by sources")
ax.pie(by_country.values(),
    labels=map(lambda (k,v):"%s (%d)"%(k,v),by_country.items()),
    shadow=True
)

ax=fig.add_subplot(222)
ax.set_title(
    "Top 10 tested users (amongst %d trials)" % len( res["by_user"])
)
by_user=ordered_top(res["by_user"])
del(by_user['other'])
labeled_bar(ax,by_user)

ax=fig.add_subplot(212)
ax.set_title("Unauthorized connections by dates")
res["date"]=OrderedDict([
    (k,v) for k,v in sorted( res["date"].items()) ]
)
ax.plot_date(plt.date2num(np.array( res["date"].keys())),
    res["date"].values(), linestyle="-")

fig.autofmt_xdate()
plt.savefig("attack.png")
Histograms or time series from CSV
CSV that can be parsed as regexp
There are simple cases when CSV don’t have strings embedded and are litteraly comma separated integers/floats.
In this case, CSV can be parsed as a regexp and it’s all the more convenient when the CSV has no title.
Here is an example using the CSV coming from the CSV generated by trollometre
A line is made off a timestamp followed by various (int) counters.
Tip
For the sake of ease of use I hacked the date_pattern format to accept “%s” as a timestamp (while it’s normally only valid strptime formater)
#!/usr/bin/env python
from archery import mdict
from yahi import notch, shoot
from json import dump
import re


context=notch("/home/jul/trollometre.csv",
    off="user_agent,geo_ip",
    log_format="custom",
    output_format="json",
    date_pattern="%s",
    log_pattern="""^(?P<datetime>[^,]+),
    (?P<nb_fr>[^,]+),
    (?P<nb_total>[^,]+),?.*
    $""")

date_formater= lambda dt :"%s-%s-%s" % ( dt.year, dt.month, dt.day)

res= shoot(
        context,
        lambda data: mdict({
            "date_fr" :
                mdict({ date_formater(data["_datetime"]) :
                    int(data["nb_fr"]) }),
            "hour_fr" :
                mdict({ "%02d" % data["_datetime"].hour :
                    int(data["nb_fr"]) }),
            "date_all" :
                mdict({ date_formater(data["_datetime"]) :
                    int(data["nb_total"]) }),
            "hour_all" :
                mdict({ "%02d" % data["_datetime"].hour :
                    int(data["nb_total"]) }),
            "total" : 1
        })
    )
dump(res,open("data.js","w"),  indent=4)
or alternatively:
from yahi.field import regexp_reader
from archery import mdict
from datetime import datetime as dt
import re
from json import dumps

hr = lambda ts: "%02d" % dt.fromtimestamp(float(ts)).hour
date = lambda ts: dt.fromtimestamp(float(ts)).strftime("%y-%m-%d")

print(dumps(
    sum(
        mdict(
            date_fr=mdict({
                date(r["datetime"]) : int(r["nb_fr"]) }),
            hour_fr=mdict({
                hr(r["datetime"]) : int(r["nb_fr"]) }),
        ) for r in regexp_reader(
            open("/home/jul/trollometre.csv"),
            re.compile("""^(?P<datetime>[^,]+),
                (?P<nb_fr>[^,]+),
                (?P<nb_total>[^,]+),?.*
                $""",
                re.X
            )
        )
    ),
    indent=4)
)
Then, all that remains to do is
yahi_all_in_one_maker
firefox aio.html
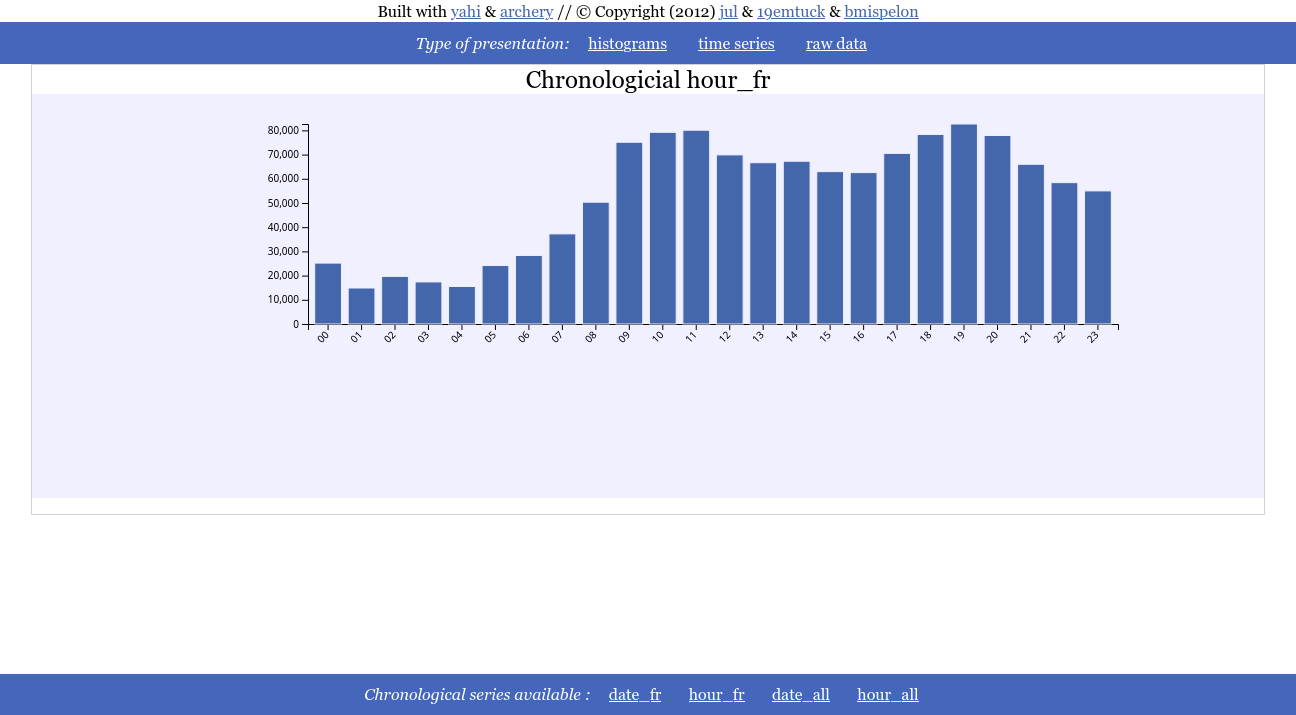
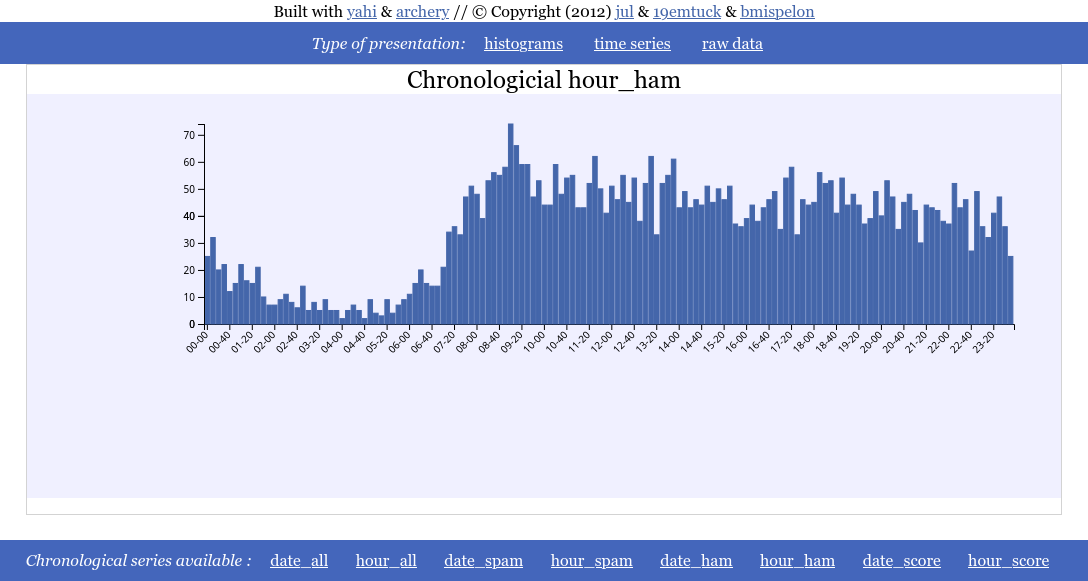
You click on time series and can see the either the chronological time serie
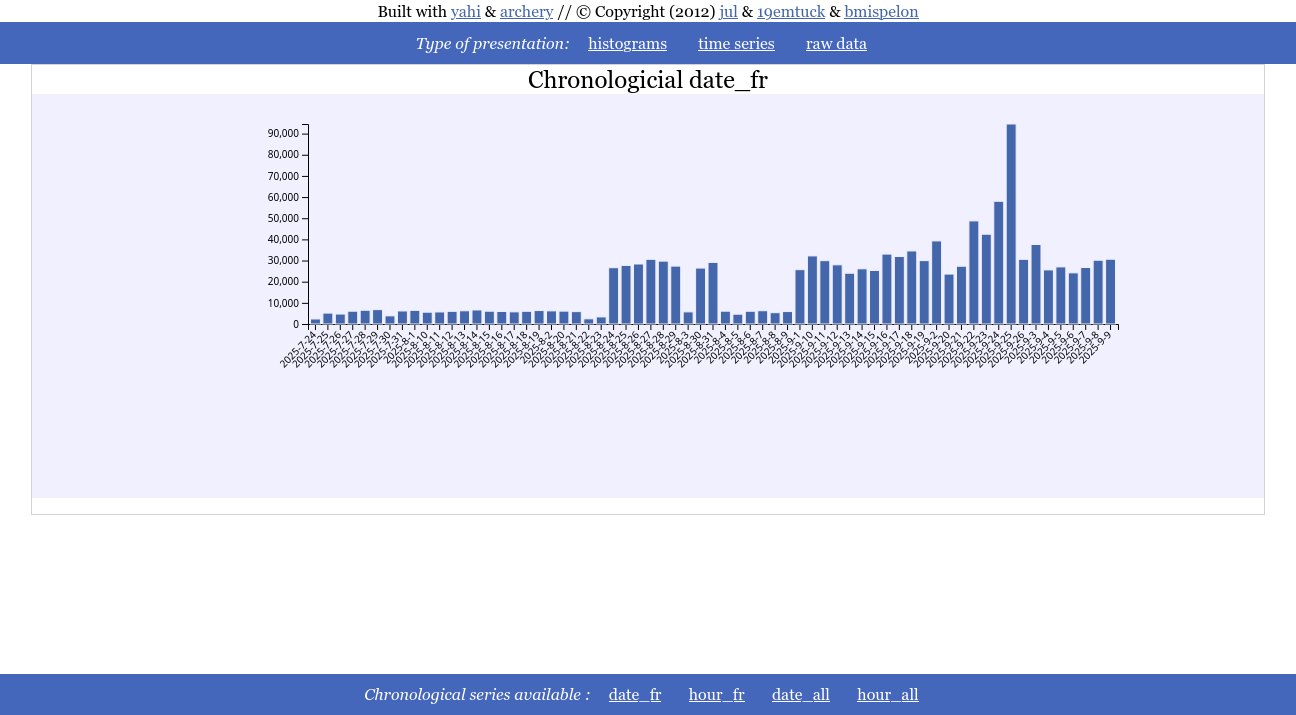
Or the profile by hour
Raw approach with csv.DictReader
Let’s take the use case where my job insurance sent me the data of all the 10000 jobless persons in my vicinity consisting for each line of :
opaque id,civility,firstname, lastname, email,email of the counseler following the job less person
For this CSV, I have the title as the first line, and have strings that may countain “,”, hence the regexp approach is strongly ill advised.
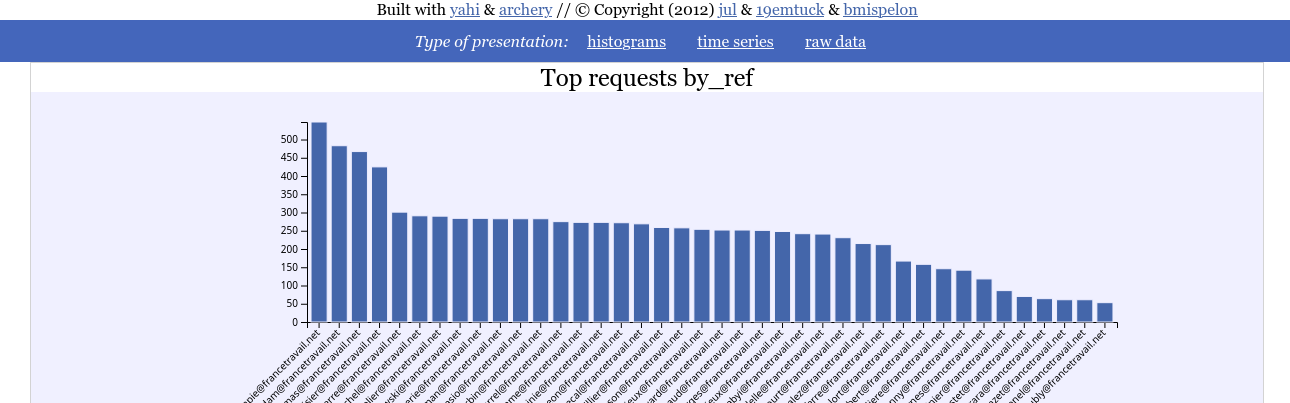
What we want here is 2 histograms :
the frequency of the firstname (that does not violates RGPD) and that I can share,
how much each adviser is counseling.
Here is the code
from csv import DictReader
from json import dump
from archery import mdict

res=mdict()
with open("/home/jul/Téléchargements/GEMESCAPEG.csv") as f:
    for l in DictReader(f):
        res+=mdict(
            by_ref=mdict({l["Referent"]: 1}),
            by_prenom=mdict({l["Prenom"]: 1}),
            by_civilite=mdict({l["Civilite"]: 1}))

dump(res, open("data.js", "w"), indent=4)
Then, all that remains to do is
yahi_all_in_one_maker && firefox aio.html
And here we can see that each counseler is following on average ~250 jobless persons.
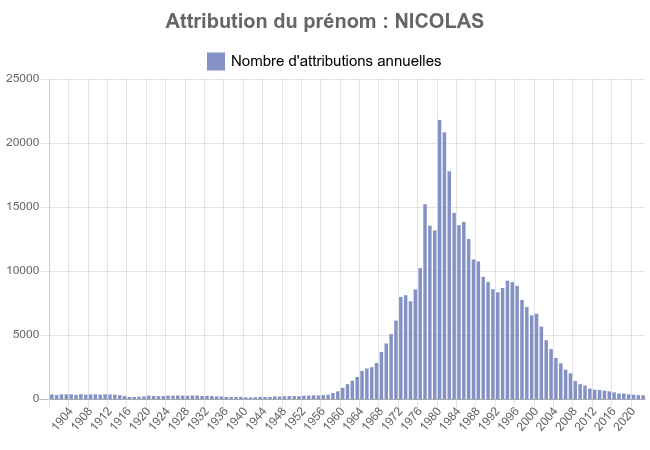
And the frequency of the firstname
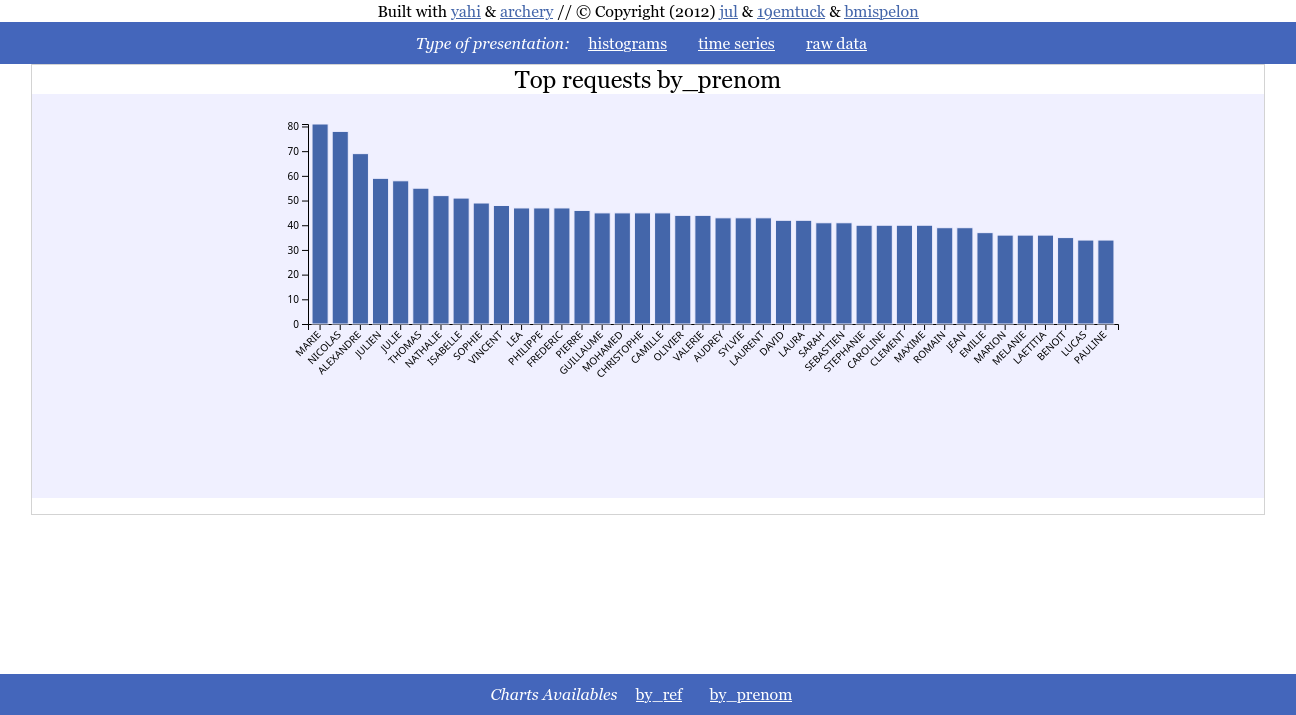
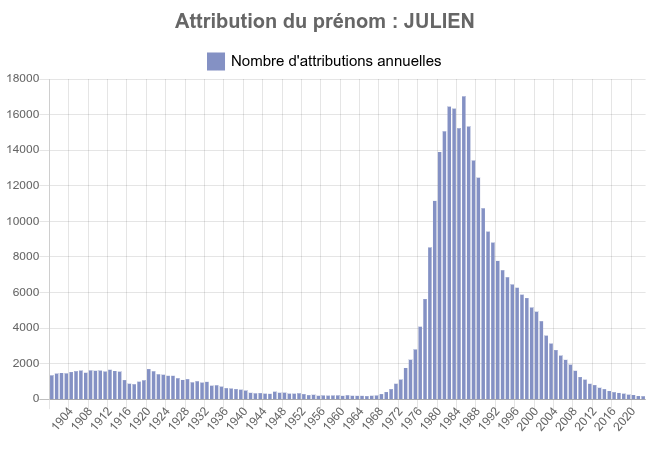
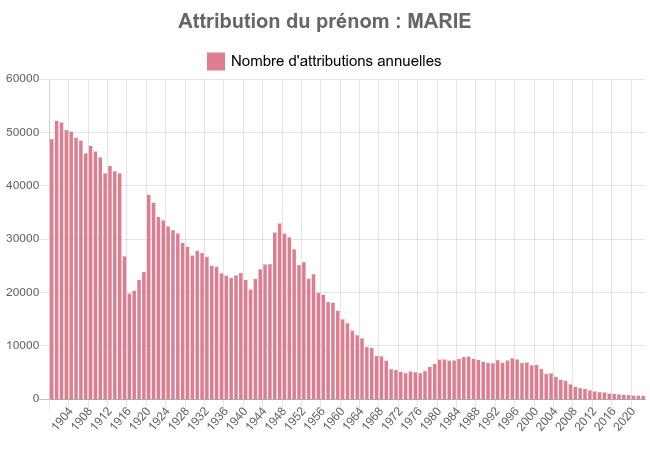
Which correlated with the demographic of the firstname as included here below tends to prove that the older you are the less likeky you are to be jobless.
I am not saying ageism, the data are doing it for me.
Graphing data from a database
Thanks to trollometre I also have real life data coming from a bluesky bot that I may want to graph with the following database structure:
CREATE TABLE posts (
    uri     TEXT PRIMARY KEY,
    url     TEXT NOT NULL,
    post JSON NOT NULL,
    created_at TIMESTAMP DEFAULT NOW(),
    is_spam BOOL,
    maybe_spam BOOL,
    score INTEGER not NULL
);
The interesting columns here are :
created_at wich is datetime at which a post is being put into base;
maybe_spam which is the value of detection of spam (99% reliable);
score which is the sum of likes, answers and repost a bluesky post got for being reposted.
from archery import mdict
from datetime import datetime as dt

from sqlalchemy.ext.automap import automap_base
from sqlalchemy.orm import Session
from sqlalchemy import create_engine
from json import dump

Base = automap_base()
engine = create_engine("postgresql://jul@/trollo")
Base.prepare(autoload_with=engine)
Posts = Base.classes.posts
session = Session(engine)

hr = lambda ts: "%02d-%02d" % (ts.hour, ts.minute - ts.minute % 10)
date = lambda ts: ts.strftime("%Y-%m-%d")
wW = lambda ts: ts.strftime("%w-%a:%Y-%U")
dh = lambda ts: ts.strftime("%H:%Y-%j %m-%d")


dump(
    sum(
        mdict(
            by_type=mdict({ post.maybe_spam and "spam" or "ham" : 1 }),
            date_all = mdict({date(post.created_at) : 1}),
            hour_all = mdict({hr(post.created_at) : 1}),
            date_spam = mdict({date(post.created_at):
                0 if post.maybe_spam is None else post.maybe_spam}),
            hour_spam = mdict({hr(post.created_at):
                0 if post.maybe_spam is None else post.maybe_spam}),
            date_ham = mdict({date(post.created_at):
                0 if post.maybe_spam is None else not post.maybe_spam}),
            hour_ham = mdict({hr(post.created_at):
                0 if post.maybe_spam is None else not post.maybe_spam}),
            date_score = mdict({date(post.created_at) : post.score}),
            hour_score = mdict({hr(post.created_at) : post.score}),
            heat_week_score = mdict({wW(post.created_at) : post.score}),
            heat_week_all = mdict({wW(post.created_at) :1}),
            heat_day_all = mdict({dh(post.created_at) :0 if post.maybe_spam is None else not post.maybe_spam}),
            heat_day_score = mdict({dh(post.created_at) :post.score}),

        )
        for post in session.query(Posts).all()
    ),
    open("data.js", "w"),
    indent=4
)
Smaller granularity than hour
Here I simply show case that hour_ category can be used for sub hour slicing, as long as you use something that is lexicographically sortable.
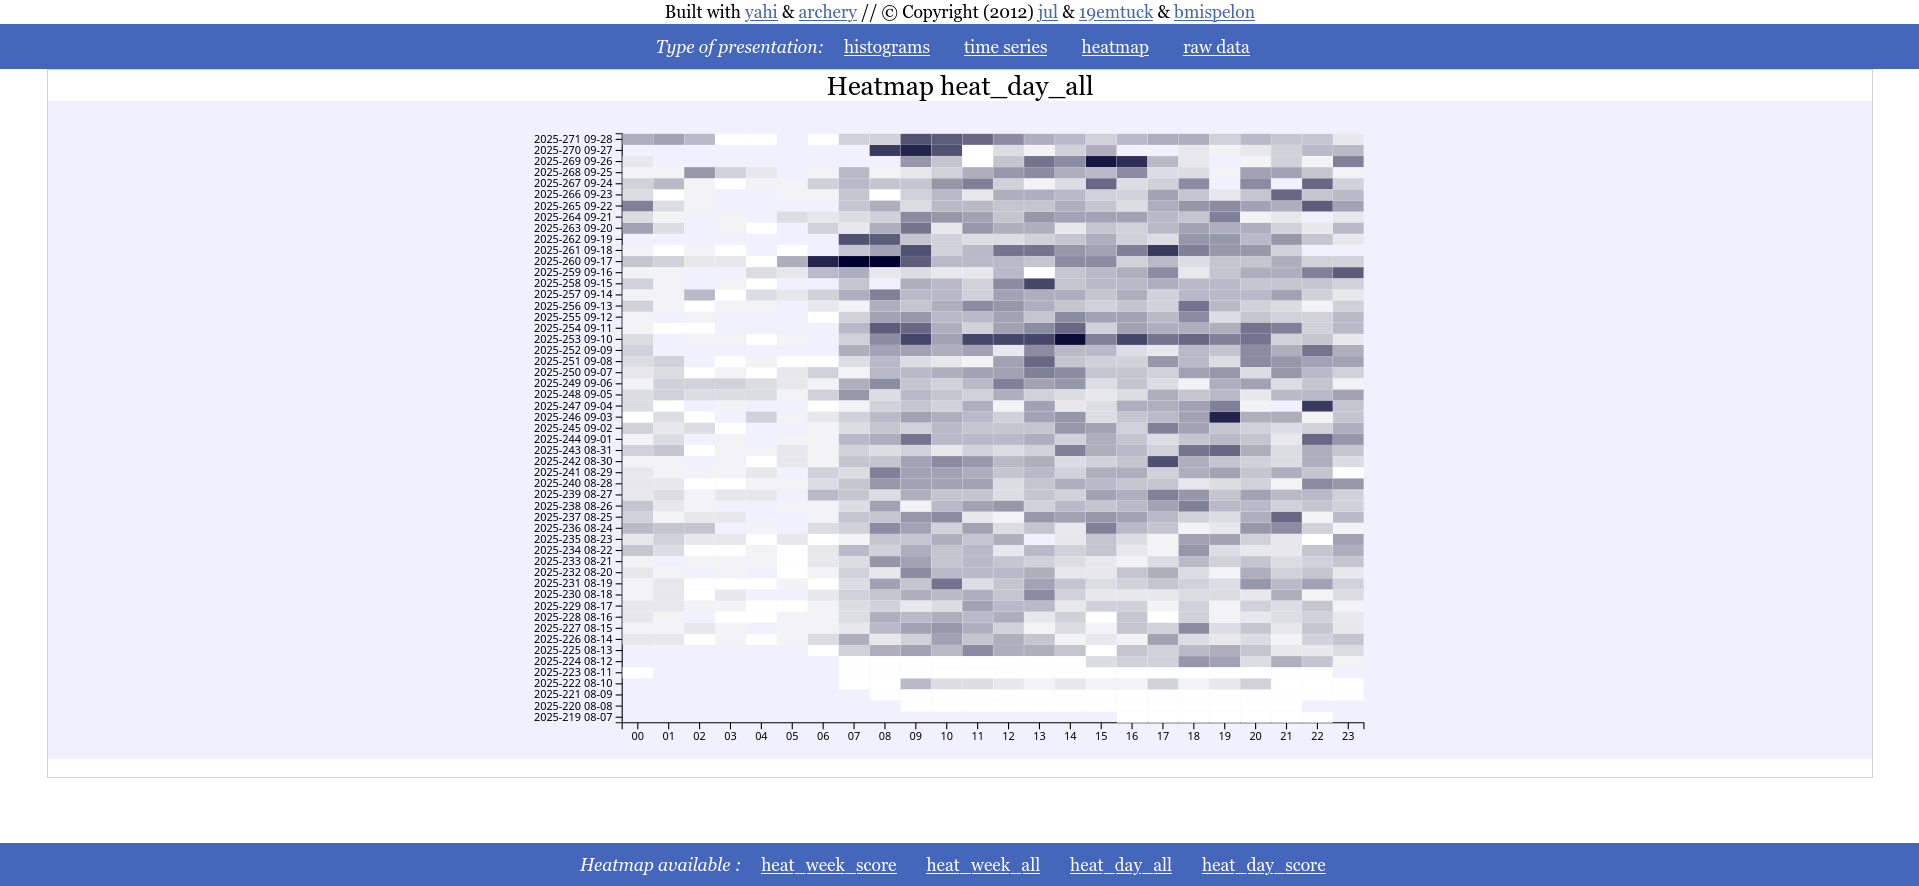
Heatmap
Heatmap generated for the scores by day of the year/hour of the day
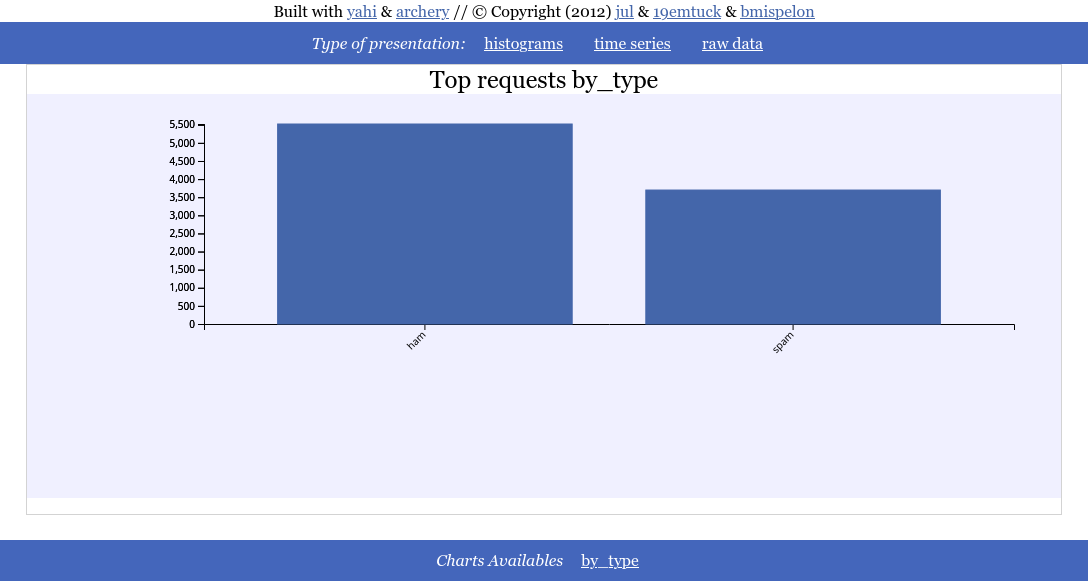
Simple histogram
Ratio of spam vs ham detected in the database
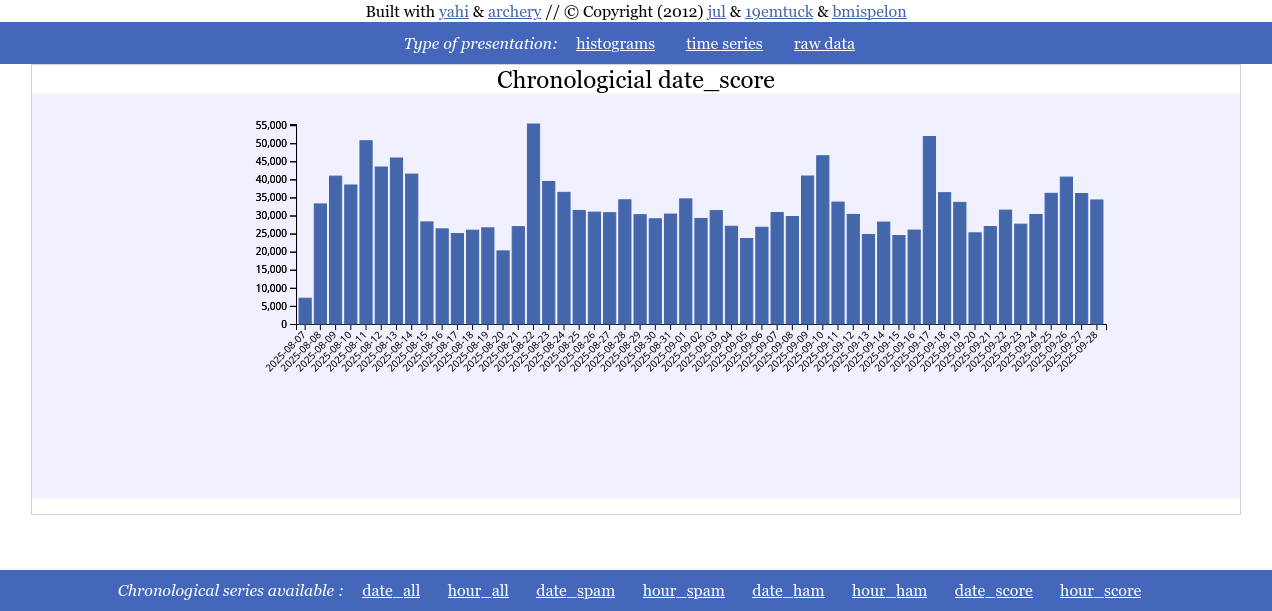
Date serie
With the cumulated score per day as a time serie you can notice that in France the 10th and 17th of september 2025 had quite an echo.
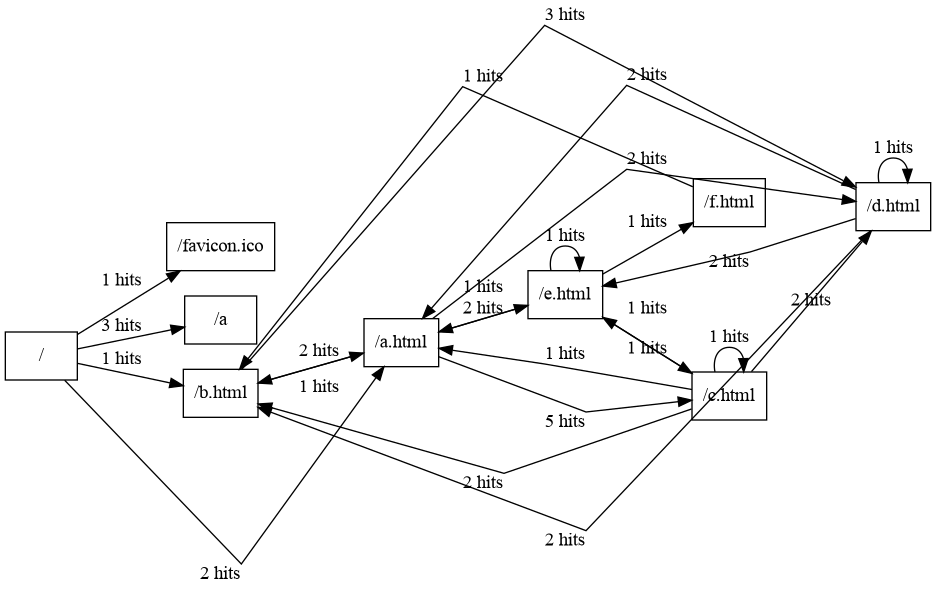
Making connection graph from web logs
A connection graph tells the journey of visitors between web pages.
Here I made a minimal web site with 5 web pages, a, b … that can be clicked to visit one another.
from yahi.field import regexp_reader
from archery import mdict
from urllib.parse import urlparse

res="""digraph {
      rankdir=LR;
      splines=false;
      node [
        shape=record
      ]

"""
for k,v in sum(
        mdict({(r["referer"], r["uri"]):1}) for r in
            regexp_reader(
                open("/var/log/nginx/access.log.1"),
                "nginx"
            )
        ).items():
    if urlparse(k[0]).netloc == 'localhost' and k[0] != '-':
        res+=f"""  "{urlparse(k[0]).path}" -> "{k[1]}" [label="{v} hits" ]\n """

res+="\n}"
print(res)
This example illustrates how to simply use the library of regexp of logs.
Result
After executing
python docs/source/test3.py | dot -T png > docs/source/dot.png
We have got the following result: